Debugging a Microchip's SmartFusion2 SoC.
 SMF2000
When I started to develop designs for FPGA, the thing that I missed from the digital signal processors is the debug capabilities. I used to debug my programs using JTAG that performs “real time” reads of the data memory, so I was able to see the value of almost any variable in “real time”. Real time is between quotation marks because obviously, you have a delay between the value change of the variable, and the update in your PC, but for the most develops I did, it was enough. I know that we can use integrated logic analyzers but they have a dark side, that is that your design is modified in order to accommodate the needed logic. In other words, the design you are debugging is different than the design will be in production, unless you decide yo include in the production design the logic analyzer, in that case you will use part of your FPGA resources in this circuit that, in most cases, you will use only once, which is not very efficient. Fortunately, the FPGA from Microchip have a very interesting feature that allow to debug, even in real time, without modify your design, isn’t cool?
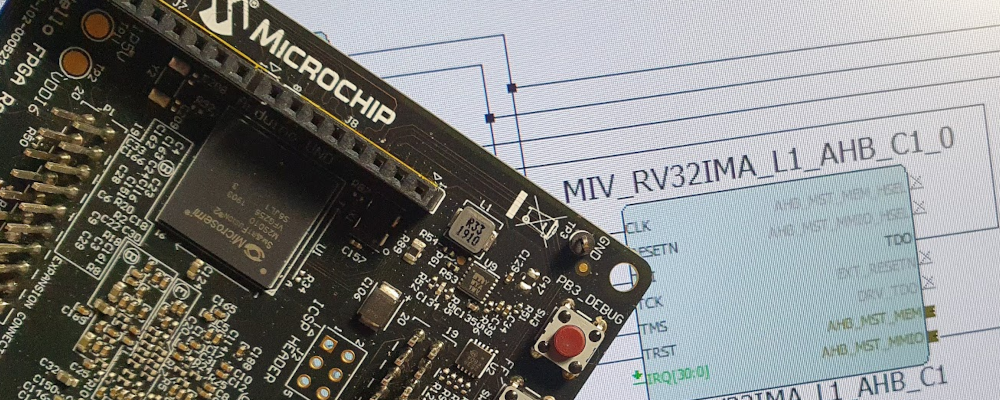
In this post I am going to show you 2 different ways to debug your design based on SmartFusion2 or IGLOO2, but this is also valid for PolaFire. As I mentioned before, Libero allow to read, write, and also connect to a pin any internal register of our design without modify it. Active probes are the equivalent to an integer logic analyzer with writing capabilities. On the other side, Live probes will allow us to connect an FPGA pin to any logic element output in our design. To test these functionalities, I will use the audio volume control design that I have used in this post, adding some modifications in order to replace the Xilinx clock wizard for a Microchip oscillator and clock conditioning circuit (CCC). The board I am going to use is the Trenz SMF2000. First of all we have to create a new project configuring the corresponding part.

Then, instead of add the files to the project, which will make a copy of the files, we are going to link the files in order to keep only one copy of our files.

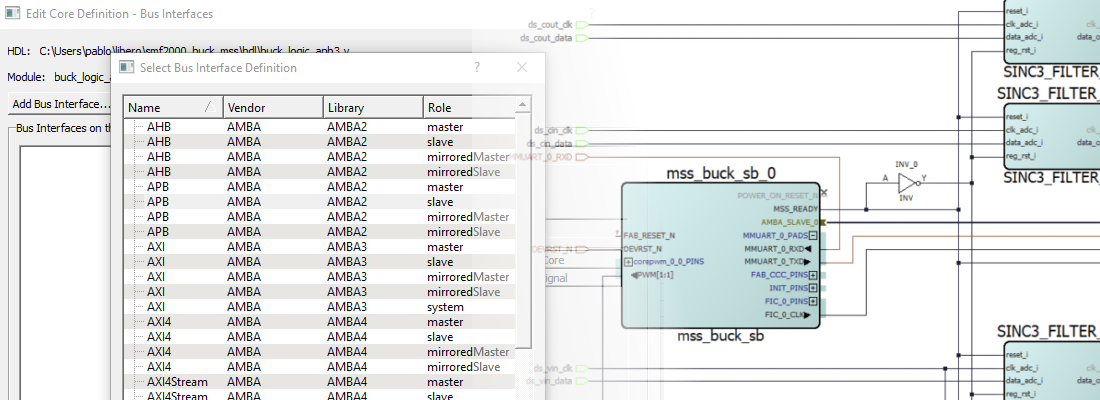
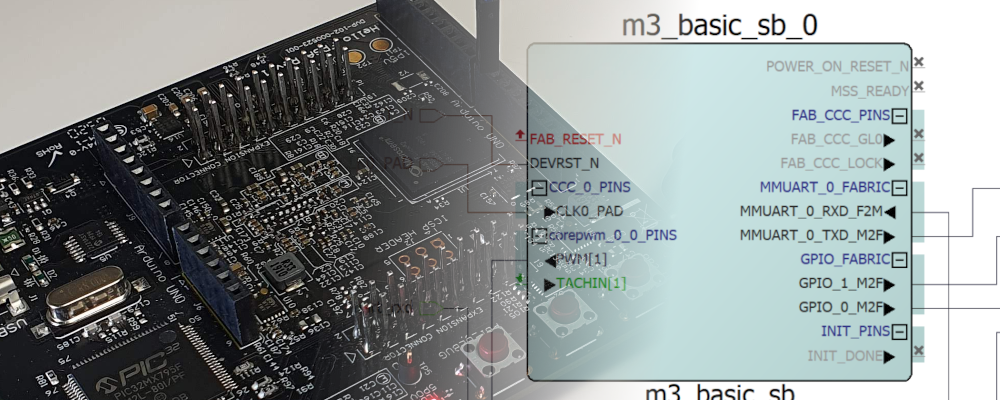
Once we have the project created, we have to modify the top file in order to delete the instantiation to the clock wizard and add the internal oscillator, and the CCC circuit. To create oscillator instantiation, we have to open the catalog, and under Clock & Management select Chip Oscilators. In this case we are going to use the internal 25/50 MHz oscillator connected to a CCC to obtain an stable clock of 25 MHz.

Next we have to add the CCC.

Finally, to complete our design, we have to add the instantiations in the top module, replacing the clk_wizard instantiation.
/* module instantiation */

/* internal oscillator */
osc_c0 osc_inst0(
.RCOSC_25_50MHZ_CCC(clkrosc)
);

/* Clock conditioning circuit */
fccc_c0 fccc_inst0(
.RCOSC_25_50MHZ(clkrosc),
.GL0(clk25mhz),
.LOCK(resetn)
);
In addition to this change, the original design used 4 switches to select the volume. In this case we only have 1 button available, so I modified the design in order to use only one button.
volume_control volume_control_inst(
.aclk(clk25mhz),
.resetn(resetn),
.i2s_data_rx(i2s_data_rx),
.i2s_rx_tvalid(i2s_rx_tvalid),
.gain({button, 3'd0}),
.i2s_data_tx(i2s_data_tx),
.i2s_tx_tvalid(i2s_tx_tvalid)
);
Finally, since the board have eight leds, I will use all of them for the vumeter.
/* vumeter */
assign led = r_data_rx[23]? -r_data_rx[22-:8]: r_data_rx[22-:8];
At this point we have or design complete, the next step will be create the constraits file in order to connect the I2S2 PMOD to the PMOD port of the SMF2000. is important in the constraints manager window, check the Reserve Pins for Probes.

Once the design is complete, we can generate the output bitstream and program the board. once the board is programmed, our design is running in the board. So the next is check the debug capabilities.
First of all we are going to use Active probes in order to verify that the data value of the read channel is changing as we can expect. In order to configure the debug session, we have to open the Smart Debug. Then, we will clock over Debug FPGA Array.

In the opened window, we have several tabs that show the different tools we can use. In this case, we will open the Active probes tab. Then, a list of all registers of the design will be shown in the left of the window. In order to check the value of any of them, we have to add it to the right panel, and click on Read Active Probes and… voilá! the value of that register will be shown.

remember that the design is kept without changes, so the design we are debugging is the same as we will use for production in a future. Active proves are a very interesting option to check the value of static signals, since the refresh rate is low. If we want to check the value of a signal in real time, Microchip also allows us to do it but only with two 1 bit signals. The tool that allow us to do this are the Live Probes.
live probes allow us to connect the output of any logic element to two dedicated pins in the FPGA, so we can see with an oscilloscope, or a digital signal analyzer, the value of two bits. Two bits seems not enough for the most of the applications, but two is greater than zero, and in many cases, check the value of one bit can show us not the problem, but the root of the problem. To configure a live probe, we have to open the corresponding tab, and select the signal we want to verify. Then adding the signal to the right panel, this signal is ready to be assigned to one of the 2 probes.

I have connected the data valid signal of the read port to the probe 1. SMF2000 board has the probes connected to two pads, so is easy to connect that signal to an scope or, in my case, to the Digital Discovery. The data valid of the read port must be a signal with a frequency near to 96kHz, that is the audio read rate configured.

Due to the nature of the FPGA, debugging is not an easy task, since the design is not running from a double port memory that can be read and write by the processor and the JTAG, FPGA are much more complex than that. Designers like me, have our own debug techniques, but the simulations turns very (very, very, …) important, so the design that we bring to the FPGA is debugged deeply. Despite of this, due to a low coverage simulations, or changing conditions in the environment, many times we will need to debug the design in the FPGA. In that situations, tools like this makes the FPGA designers life easiest.